
Merakifly Technical Documentation
Overview
evoila Merakifly software simplifies the health-check process for all organization-connected devices. It transforms into an effective network troubleshooting tool by systematically identifying and presenting relevant device information.
With this software, gain a comprehensive overview of your organization’s networks, including insights into current device statuses, network details, and a history of errors and event logs.
Login page
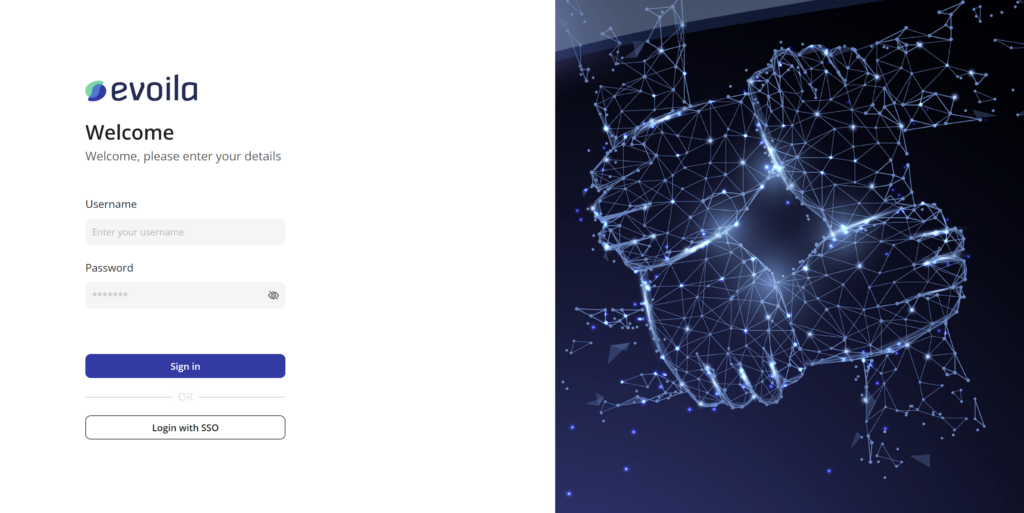
The login page serves as the gateway for users to access secured areas within the application. It provides a straightforward interface for users to authenticate themselves and gain entry into the system. When users submit their credentials on the login page, the LoginComponent verifies this information through authentication mechanisms, which may include our internal authentication system or external identity providers like Azure or GitHub. If the credentials are valid, users are redirected to the dashboard. In case of invalid credentials or network issues, error-handling mechanisms ensure users receive helpful feedback.
Dashboard
After successful login, the user is redirected to the dashboard, where they can view a list of the networks provided by the organization.
Networks list
Each network listing in the dashboard includes the following information:
- Network Name: The name of the network which serves as its identifier
- Status Indicator: An indicator that visually represents the status of the network. The available statuses for networks are:
- Green indicator means that the network doesn’t have recent alerting or offline devices
- Red indicator means that network has some recently offline devices
- Yellow indicator means that network have recently alerting devices
- Gray indicator means that all nodes have been offline more than one week
- Tags: Tags associated with the network, providing additional information such as the network’s region or function

User Information
At the top-right corner of the page, users see their username along with a user icon. This setup allows for quick access to logout functionality and provides a visual indication of the logged-in user.
Search Functionality
The dashboard features two distinct search functionalities:
- Main Search (Top): The main search bar at the top of the dashboard serves as a quick navigation tool. Users can enter specific search criteria and upon pressing enter, the system immediately redirects them to the network details page. This makes it easy for users to navigate and find the information they need.
- Table Header Search: The search bar in the table header lets users filter and find specific networks in the list. When users type in their search, the list automatically updates to show only the networks that match their search. This makes it easier for users to find what they’re looking for quickly and efficiently.
Network details
When users are redirected to the Network Details page, they have access to detailed information about the network and can take particular actions.
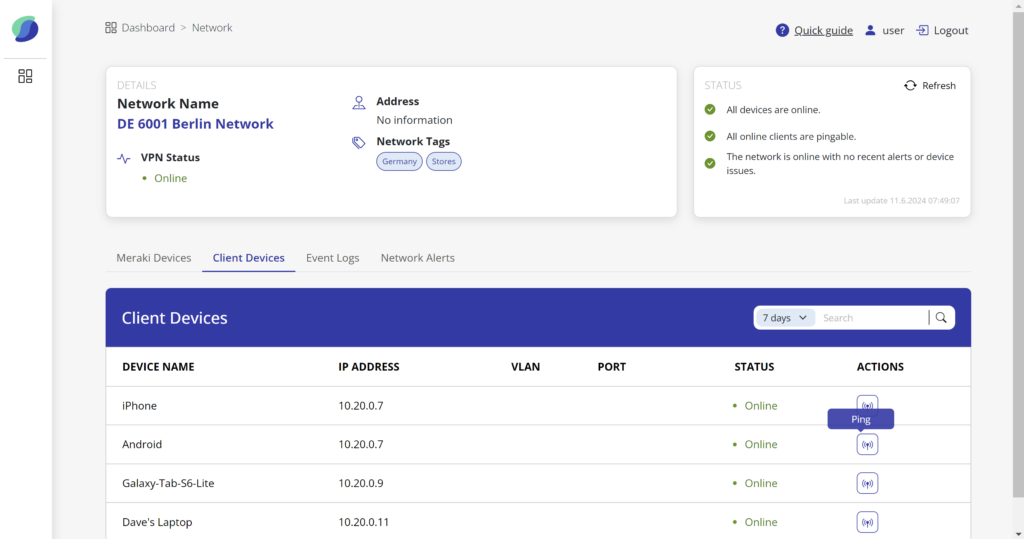
The page is divided into three main parts:
Basic Information
This section displays fundamental details about the network, including:
- Name: The network’s identifier
- Address: The physical address of the network
- Tags: Any tags associated with the network, providing additional context such as its region or function
Statuses Card
The statuses card provides an overview of the network’s health by displaying:
- Online Status: Indicates whether all devices in the network are online
- Pingable Status: Shows if all devices can be pinged successfully
- Network Issues and Alerts: Highlights any issues currently affecting the network
Tabs with Tables
The page features tabs with corresponding tables for more detailed information. These tabs include:
- Meraki Devices: Displays detailed information about Meraki devices on the network
- Client Devices: Provides details about Client devices connected to the network
- Event Logs: Logs events and activities related to the network, allowing users to track changes
- Network Alerts: Highlights any alerts or notifications regarding the network’s performance
This structured layout allows users to quickly access the information they need and perform necessary actions for troubleshooting.
Configuration Check and Alerts
The configuration check is a vital integrated feature that ensures that devices are correctly connected and configured according to predefined network settings. This check includes:
- Error Indication: If a device is connected to the wrong port, an indication is shown next to the affected device in both the Meraki Devices and Client Devices tables
- Alert Badges: The number of configuration alerts is displayed as a badge on the tabs, providing a clear visual cue of any configuration issues present
Meraki Devices
The Meraki Devices table displays a comprehensive list of all Meraki devices connected to the network.
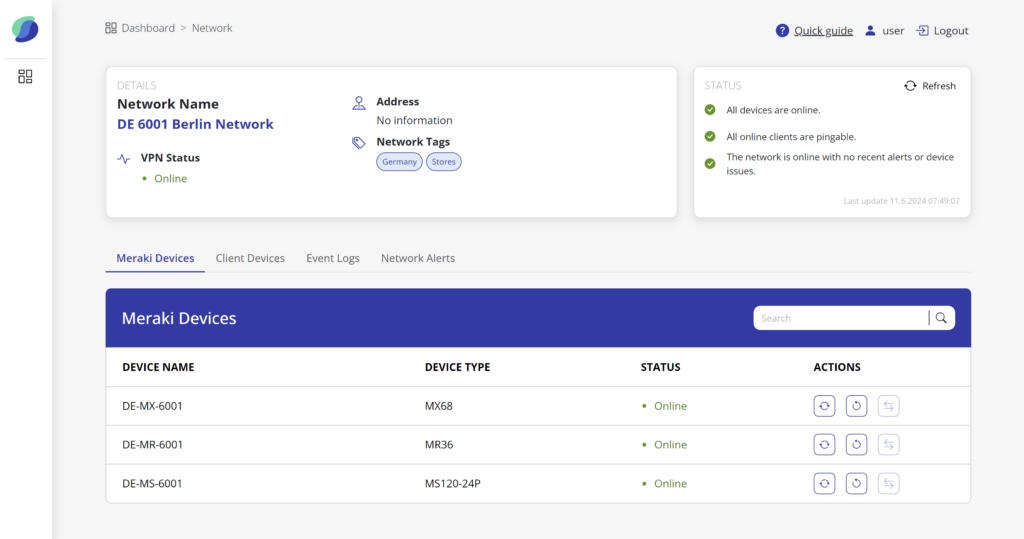
It provides essential details about each device, such as its name, device type, status, and allows users to perform various actions to manage these devices effectively. Below are the available action buttons along with their descriptions:
- Restart: This button is used to initiate a device restart, which can be valuable for resolving device-related issues and maintaining smooth operation. Clicking the Restart button prompts a confirmation modal to ensure intentional action before initiating the restart.
- Refresh: Clicking Refresh button retrieves the latest information about the selected device, ensuring that users have access to the most up-to-date data.
- Replace: This upcoming feature simplifies the task of replacing device data within the network. It offers a convenient way to manage device information without the need for manual deletion and re-adding.
- Port Cycle: Port cycling involves the process of resetting or cycling through the ports of a network switch. This action can help resolve connectivity issues or refresh the network configurations associated with specific ports, ensuring stable and efficient communication within the network. Clicking the Port Cycle button prompts a confirmation modal to ensure intentional action before initiating the port cycling process.
Client Devices
The Client Devices table displays a comprehensive list of all Client devices connected to the network.

It is structured with six columns:
- Device Name: Displays the name of each connected client device
- IP Address: Shows the corresponding IP address for each device
- VLAN: Shows the VLAN (Virtual Local Area Network) ID associated with the device
- Port: Indicates the port number to which the device is connected
- Status Indicator: The fifth column includes a status indicator along with a label that represents the current status of the device
- Action: The last column allows users to ping the device, verifying its reachability within the network and port cycling to manage connectivity
Additionally, users can apply filters to display client devices connected within the last 7 days, 15 days, or 30 days, allowing for a more focused view based on recent activity.
Event Logs
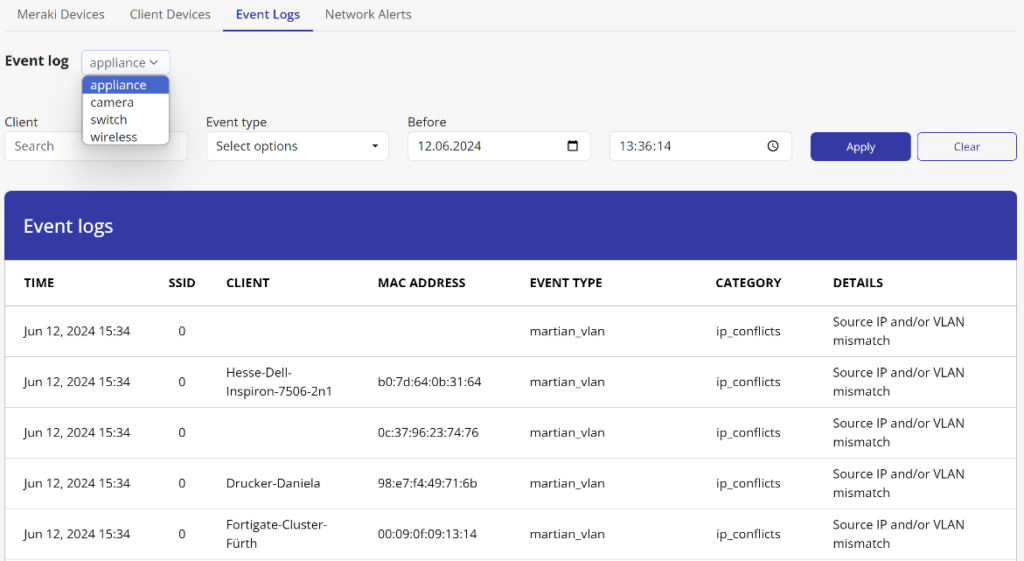
In the Event Logs table, you’ll find a comprehensive record of the latest network events. With filtering options available for specific clients, event types, and timespans, you can easily narrow down your search. Additionally, you can explore events across various product types, such as appliances, cameras, wireless devices, switches, and system managers.
Network Alerts
In the Network Alerts table, you’ll find a summary of the most recent alerts detected on your network. This table comprises five columns, each providing valuable information:
- Severity: Indicates the level of severity associated with the alert
- Alert: Describes the nature of the alert or issue detected
- Details: Provides additional information or context about the alert
- Devices: Specifies the devices affected by the alert
- Category: Categorizes the alert based on its nature or impact

This structured layout helps users quickly understand and address network issues by providing essential details about each alert detected.
Merakifly InApp guides
When a potential issue is identified, we’ll provide you with helpful guides on how to resolve it. Look out for the popup icon, designed in the style of a new idea, indicating actionable solutions.
Click on this icon to open a modal with step-by-step instructions tailored to address the identified problem.
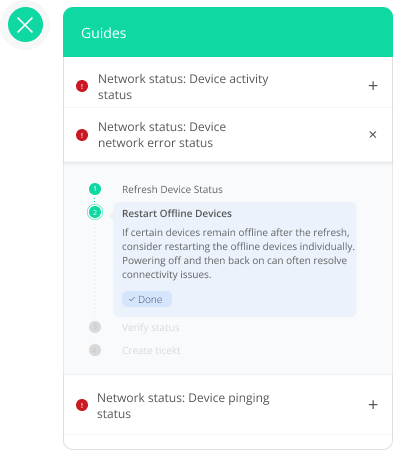
These informative guide popups will appear in various locations whenever the expected outcome is not met. If the issue persists despite following these steps, the next step is to create a ticket. When creating a ticket, you’ll choose the priority level and provide any additional information necessary to assist in resolving the issue promptly.