Frontend Observability: Improving users experience by knowing how your site is performing
The summarised version of this article was posted at mirzamuric.com/blog/frontend-observability.
The performance of your website or app directly impacts user satisfaction. Frontend observability allows you to monitor how your site is performing, enabling quick fixes before issues affect users. By tracking real-time data, we can optimize your site’s speed, minimize errors, and create a smoother experience for users.
Using tools like OpenTelemetry, Faro SDK, and Grafana Cloud, you can monitor critical aspects of your site. This ensures a fast, reliable, and error-free experience that builds trust and keeps users engaged.
Why Frontend Observability Matters for Users
Frontend observability helps identify and resolve issues that affect users while interacting with your site. Whether it’s slow-loading pages or a payment process failure, you can quickly identify and resolve the problem. The quicker issues are addressed, the better the experience for users, leading to improved satisfaction and fewer drop-offs.
Benefits for Users:
- Faster load times mean users don’t have to wait for pages to appear.
- Fewer errors lead to smoother navigation and less frustration.
- Improved performance results in a more enjoyable experience, encouraging users to stay engaged.
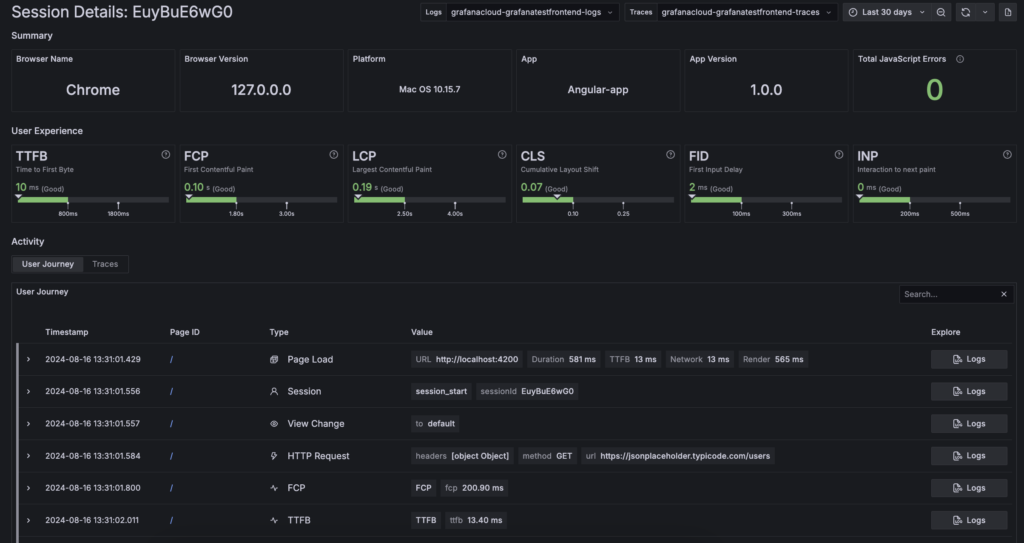
Key Metrics To Monitor
To ensure the best user experience, you can track several key performance metrics. These metrics help identify where improvements are needed.
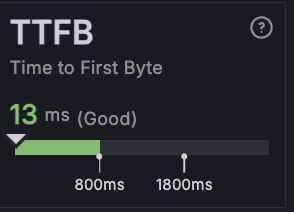
TTFB (Time to First Byte)
- What It Does: Measures the time from when the user makes a request to the first byte of response from the server.
- Why It Matters: A low TTFB helps ensure that the server is responsive and that the network conditions are good, giving the user a perception of a fast-loading page.
- Example: On an e-commerce site, a fast TTFB means that users see that their product search results are loading quickly, which can encourage continued interaction and reduce bounce rates.
FCP (First Contentful Paint)
- What It Does: Measures how quickly the first piece of content (text, image, or other elements) appears on the user’s screen.
- Why It Matters: A faster FCP gives users immediate feedback that the page is loading, reducing the likelihood they’ll leave.
- Example: On a news website, ensuring that headlines and images load quickly keeps readers engaged and encourages them to continue exploring articles.

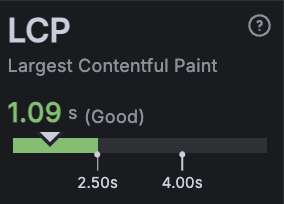
LCP (Largest Contentful Paint)
- What It Does: Tracks the loading time of the largest content element visible in the viewport, such as a main image or headline.
- Why It Matters: A fast LCP ensures that the most significant content is available promptly, improving user satisfaction.
- Example: On an online store, quickly loading product images and descriptions allows users to browse and make purchasing decisions without frustration.
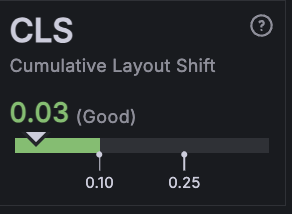
CLS (Cumulative Layout Shift)
- What It Does: Measures the visual stability of your site by tracking unexpected layout shifts during page load.
- Why It Matters: Reducing layout shifts prevents users from accidentally clicking the wrong elements and improves the overall user experience.
- Example: On a blog, preventing text and images from shifting as the page loads ensures that users can read content without distractions or misclicks.
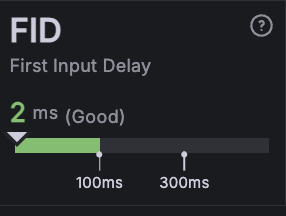
FID (First Input Delay)
- What It Does: Measures the time from when a user first interacts with your site (e.g., clicks a link or button) to when the browser responds.
- Why It Matters: A low FID means your site is responsive to user input, enhancing usability.
- Example: In an online form, ensuring that fields respond immediately when clicked helps users complete submissions efficiently.
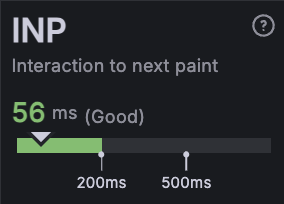
INP (Interaction to Next Paint)
- What It Does: Measures the latency from when a user interacts with your site to the time when the browser can update the visual response on the screen.
- Why It Matters: A low INP indicates that the application feels more instant and responsive, improving the interactive user experience.
- Example: During a high-interactivity session, such as online gaming or interactive quizzes, a lower INP ensures that user actions result in nearly instantaneous visual feedback, keeping the session engaging and responsive.
Additional Tools We Use to Improve User Experience
Along with performance metrics, you can use several other tools to ensure users have the best experience possible.
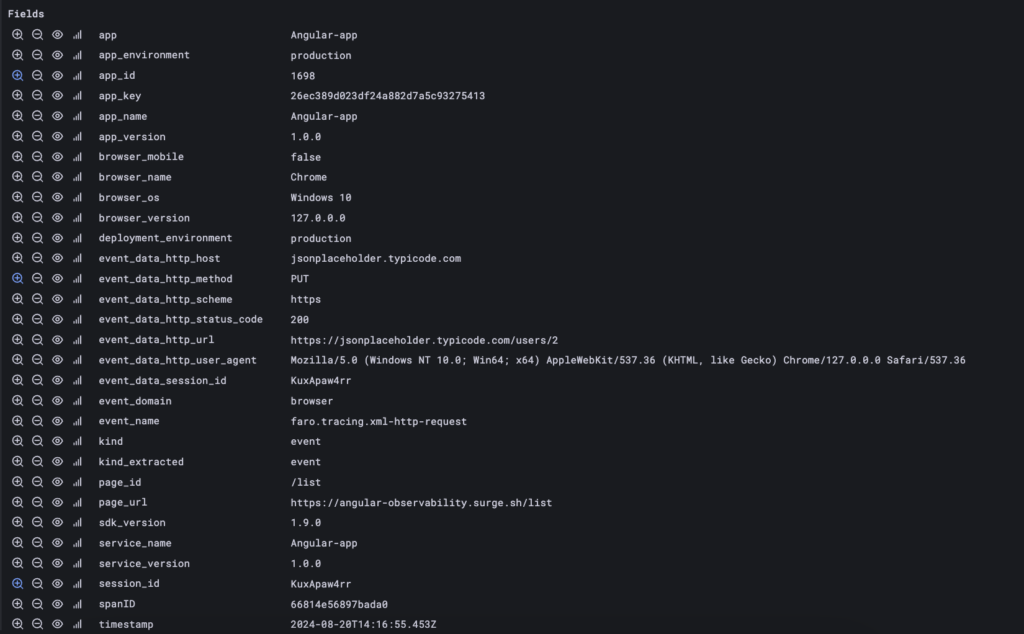
Event Tracking
- What It Does: Tracks user events such as clicks, form submissions, and more.
- Why It Matters: Helps identify user behavior patterns and areas where users might encounter difficulties.
- Example: If users frequently abandon the signup process after clicking “Sign Up,” event tracking can help us figure out where they are getting stuck and improve that experience.
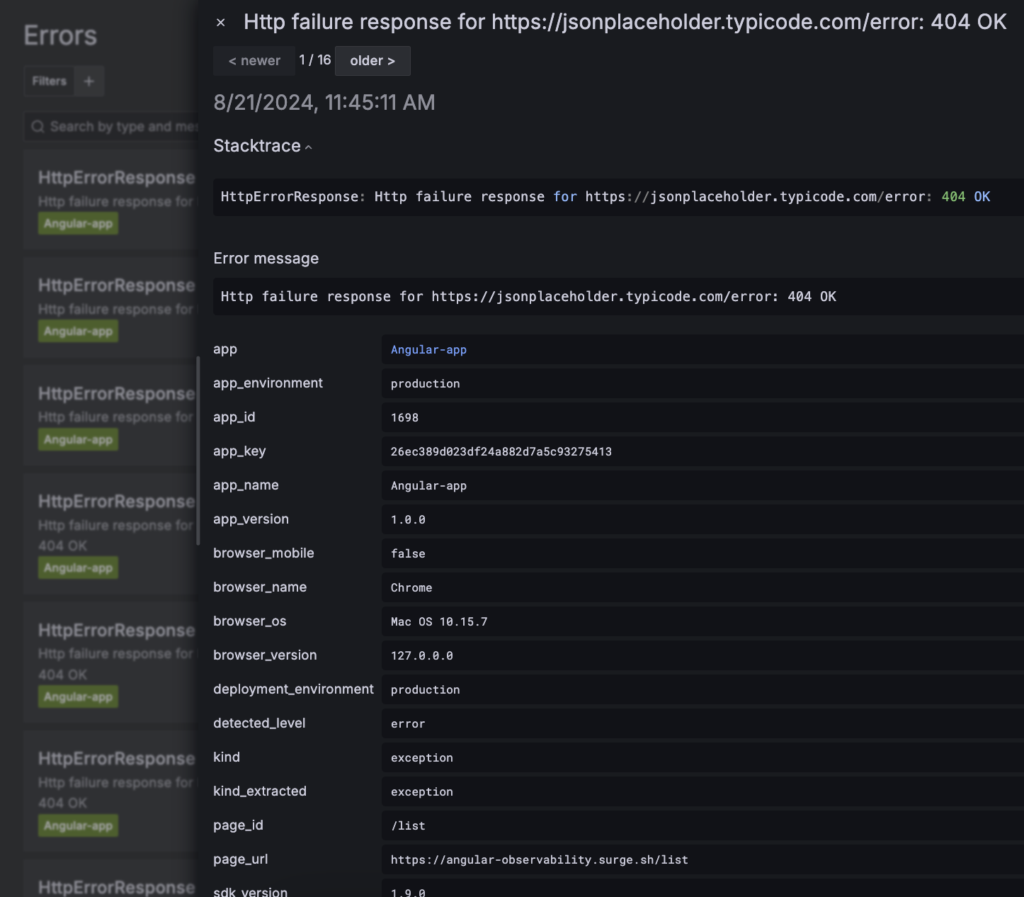
Error Tracking
- What It Does: Logs errors in real-time, such as broken links or unresponsive buttons.
- Why It Matters: Fixing errors quickly improves user satisfaction and prevents frustration.
- Example: On a shopping site, error tracking helps resolve issues with broken checkout buttons, ensuring users can complete purchases without problems.
Custom Faro Messages
- What It Does: Logs specific user actions or workflows for detailed analysis.
- Why It Matters: Helps identify where in the process users encounter issues, especially in critical workflows like payment.
- Example: In a payment process, custom messages log each step—form submission, card validation, and transaction approval—helping us identify where issues arise if a payment fails.
// Simulated transaction processing
const transactionResult = await processTransaction(paymentDetails);
if (transactionResult.success) {
faro.api.pushEvent("Transaction Approved", {
transactionId: transactionResult.id,
});
} else {
faro.api.pushEvent("Transaction Failed", {
reason: transactionResult.errorMessage,
});
throw new Error("Transaction failed");
}
Code snippet of simulated transaction processing
Session Tracking
- What It Does: Records and analyzes individual user sessions on your site or application.
- Why It Matters: Provides insights into user behavior, engagement patterns, and potential pain points during a single visit.
- Example: On an e-commerce site, session tracking can reveal how long users spend browsing, which pages they visit, and at what point they might abandon their shopping cart, allowing for targeted improvements to the user experience.
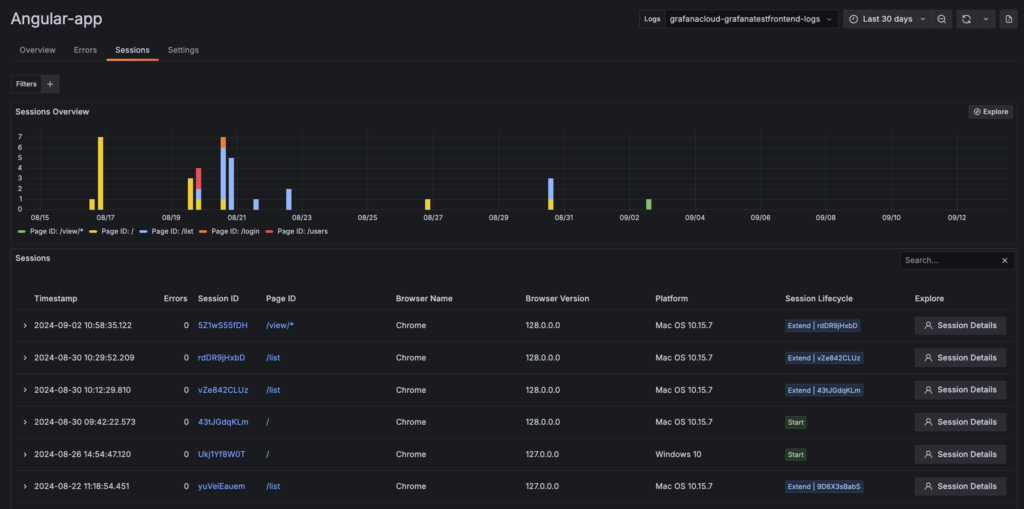
Session tracking can include metrics such as:
- Pages visited per session
- Events triggered (e.g., product views, add-to-cart actions)
- Exit pages
By analyzing this data, you can identify areas for improvement and enhance overall user satisfaction.
Real-Life Examples: Solving Common User Experience Problems
Example 1: Reducing Payment Failures on an E-commerce Site
Imagine a customer trying to complete a purchase, but their payment keeps failing. Without observability, it’s hard to know why. With custom Faro messages, we can track every step in the payment process to see if the issue is with card validation, the payment processor, or something else. This reduces the risk of users abandoning their purchase and improves the overall checkout experience.
Example 2: Fixing User Drop-Offs on a Signup Form
If users are abandoning the signup process, click tracking shows where they are getting stuck. For example, if many users leave halfway through a signup form, we can simplify the form to reduce friction and improve completion rates.
Example 3: Managing Traffic Spikes During a Promotion
During a promotion, your site might experience a surge in traffic, slowing down page load times. By monitoring LCP and error tracking, we can quickly identify performance bottlenecks and optimize the server or code, ensuring users don’t experience delays or errors.
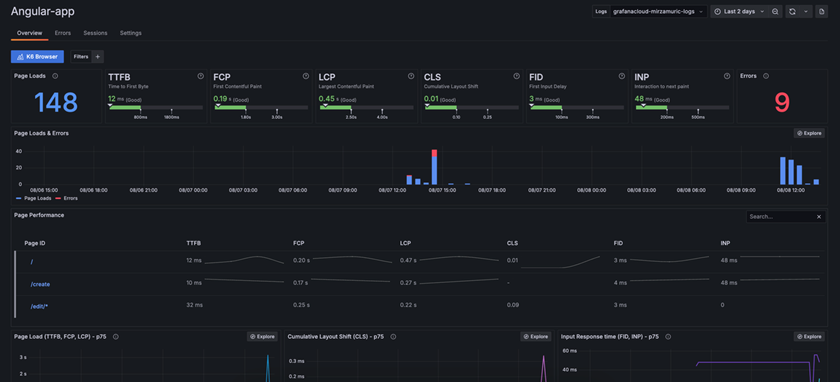
Monitoring with Grafana Cloud
All of this data is monitored in Grafana Cloud, which provides real-time insights into your site’s performance. With Grafana Cloud, you can:
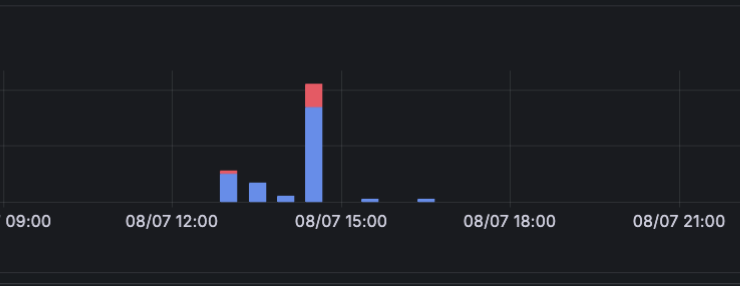
- Track page load times, errors, and user behavior in real-time.
- Get alerts for performance issues, allowing us to fix them quickly.
- Analyze trends over time to continuously improve the user experience.
With frontend observability, you can ensure your site runs properly, loads quickly, and experiences fewer errors, leading to a better experience for users.
User experience is key to your website’s success, and frontend observability is the first step towards ensuring a smooth, error-free experience. With the right tools and metrics, you can monitor, analyze, and optimize your site in real-time.
Get in touch now to learn how we can help you implement frontend observability with tools like Grafana Cloud, OpenTelemetry, and Faro SDK. Let’s work together to boost your site’s performance, reduce errors, and enhance user satisfaction!
Relevant posts

Building an Open-Source Observability Stack for OpenTelemetry
In today’s distributed application environments, having a robust observability stack is critical for monitoring and troubleshooting. In this post, we’ll walk through how...

Spring Boot 3 & JWT Authentication: Leveraging Spring Security’s Built-in Support
When implementing JWT authentication in Spring Boot, the default approach for most developers is to use a third-party library like...

NSX Identity Firewall – A Case Study With the Flavour VDI
DisclaimerThere are of course other ways of using the Identity Firewall. This is the way I have used it with...

Schema-Driven Messaging with Avro: A Practical Guide for Engineers
Message queues and event streams are foundational to modern distributed systems. They decouple producers and consumers, improve resilience, and allow...

Power Platform vs. classical programming
Advantages and limitations of low-code The development of individual software for mapping business processes has undergone a remarkable transformation in...

How complex is a migration from Citrix or RDS to Horizon really?
Technically manageable – organizationally often made more complicated than necessary. A migration from Citrix or traditional RDS environments to Horizon...
You need to load content from reCAPTCHA to submit the form. Please note that doing so will share data with third-party providers.
More Information