Building an Open-Source Observability Stack for OpenTelemetry
In today’s distributed application environments, having a robust observability stack is critical for monitoring and troubleshooting. In this post, we’ll walk through how to set up a complete open-source observability stack using Docker Compose.
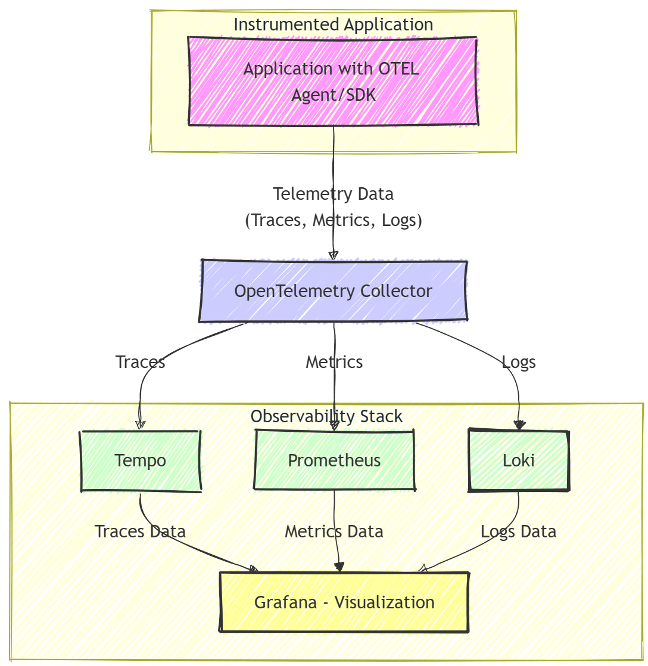
Our stack leverages several popular projects:
- OpenTelemetry Collector: Serves as the central hub for ingesting telemetry (metrics, traces, and logs) from your applications.
- Prometheus: Scrapes and stores metrics.
- Loki: Collects and indexes logs.
- Tempo: Handles distributed traces.
- Grafana: Provides a unified dashboard to visualize and explore your telemetry data.
Below is the Docker Compose file that brings these services together.
Docker Compose File Overview
File docker-compose.yml:
version: '3.8'
services:
  collector:
    container_name: collector
    image: otel/opentelemetry-collector-contrib:latest
    volumes:
      - ./config/otel-collector.yml:/etc/otelcol-contrib/otel-collector.yml
    command:
      - --config=/etc/otelcol-contrib/otel-collector.yml
    restart: always
    ports:
      - "4317:4317" # OTLP gRPC receiver
      - "4318:4318" # OTLP HTTP receiver

  prometheus:
    container_name: prometheus
    image: prom/prometheus:latest
    volumes:
      - ./config/prometheus.yml:/etc/prometheus/prometheus.yml
      - prometheusdata:/prometheus
    command:
      - --config.file=/etc/prometheus/prometheus.yml
      - --web.enable-remote-write-receiver
      - --web.enable-otlp-receiver
      - --enable-feature=exemplar-storage
      - --storage.tsdb.retention.time=15d
    restart: always
    ports:
      - '9090:9090'
    depends_on:
      - collector

  loki:
    container_name: loki
    restart: always
    image: grafana/loki:latest
    volumes:
      - lokidata:/loki
    ports:
      - "3100:3100"
    depends_on:
      - collector

  tempo:
    container_name: tempo
    restart: always
    image: grafana/tempo:latest
    volumes:
      - ./config/tempo.yml:/etc/tempo.yml
      - tempodata:/var/tempo
    command:
      - -config.file=/etc/tempo.yml
    ports:
      - "3200:3200"  # tempo

  grafana:
    container_name: grafana
    image: grafana/grafana
    restart: always
    volumes:
      - ./config/grafana-datasources.yml:/etc/grafana/provisioning/datasources/datasources.yml
      - grafanadata:/var/lib/grafana
    ports:
      - "3000:3000"

volumes:
  grafanadata:
  prometheusdata:
  lokidata:
  tempodata:
What Each Service Does
OpenTelemetry Collector
The collector is the entry point for telemetry data coming from your instrumented applications. By using the OTEL Collector (from the otel/opentelemetry-collector-contrib image), you can receive data over multiple protocols. In our setup, we expose two ports:
- 4317: For OTLP gRPC.
- 4318: For OTLP HTTP.
The collector uses a configuration file (./config/otel-collector.yml) that defines receivers, processors, and exporters to route the data to downstream services.
Prometheus
Prometheus collects and stores metrics. In our Compose file:
- We mount a custom Prometheus configuration (./config/prometheus.yml) to specify scrape jobs and remote-write settings.
- The container also enables OTLP receiver support and exemplar storage for better integration with trace data.
- Data is persisted in the prometheusdata volume, and Prometheus is available on port 9090.
Loki
Loki is designed for aggregating and indexing logs. It is a lightweight solution that integrates seamlessly with Grafana. In this stack:
- Loki stores its data in the lokidata volume.
- It listens on port 3100 and depends on the collector to potentially receive log data from your applications or even from the OTEL Collector if you configure it accordingly.
Tempo
Tempo is Grafana’s distributed tracing system. It’s built to scale and is optimized for high cardinality tracing data:
- Tempo’s configuration is provided via ./config/tempo.yml.
- Traces are stored persistently in the tempodata volume.
- The service is exposed on port 3200.
Grafana
Grafana is our unified observability dashboard:
- Grafana is set up with a pre-provisioned datasource configuration file (./config/grafana-datasources.yml), which automatically configures data sources for Prometheus, Loki, and Tempo.
- Data is persisted in the grafanadata volume.
- The dashboard is accessible on port 3000.
Configuration Files
While the Docker Compose file sets up the containers and mounts the necessary configuration files, you’ll need to create these files in a local ./config directory. Here’s a brief overview of what each file should include:
- otel-collector.yml:
Define your receivers (e.g., OTLP), processors, and exporters (e.g., to Prometheus, Loki, Tempo). Customize it based on your telemetry needs.
receivers:
  otlp:
    protocols:
      grpc:
        endpoint: 0.0.0.0:4317
      http:
        endpoint: 0.0.0.0:4318

# Define processors to process received data.
# See https://opentelemetry.io/docs/collector/configuration/#connectors
connectors:
  # The spanmetrics connector is used to output span metrics based on received trace spans.
  spanmetrics:
    namespace: traces.spanmetrics   # Prefix all metrics with `traces.spanmetrics` (this becomes `traces_spanmetrics`).
    # Determine the type of histogram to use for span metrics.
    histogram:
      explicit:                     # Explicit histograms have pre-defined bucket sizes (use default here).
    # Defines additional label dimensions of the metrics from trace span attributes present.
    dimensions:
      - name: http.method
      - name: http.target
      - name: http.status_code
      - name: service.version
    # Ensure exemplars are enabled and sent to the metrics store.
    exemplars:
      enabled: true


processors:
  batch:
  # The tail sampler processor will only keep traces where spans match the defined policies.
  tail_sampling:
    decision_wait: 30s    # The time to wait for a decision to be made.
    # The following policies follow a logical OR pattern, meaning that if any of the policies match,
    # the trace will be kept. For logical AND, you can use the `and` policy. Every span of a trace is
    # examined by each policy in turn. A match will cause a short-circuit.
    policies: [
      # This policy defines that traces that include spans that contain errors should be kept.
      {
        name: sample-erroring-traces,           # Name of the policy.
        type: status_code,                      # The type must match the type of policy to be used.
        status_code: { status_codes: [ERROR] }  # Only sample traces which have a span containing an error.
      },
      # This policy defines that traces that are over 200ms should be sampled.
      {
        name: sample-long-traces,               # Name of the policy.
        type: latency,                          # The type must match the type of policy to be used.
        latency: { threshold_ms: 200 },         # Only sample traces which are longer than 200ms in duration.
      },
    ]

exporters:
  otlphttp/prometheus:
    endpoint: http://prometheus:9090/api/v1/otlp
  otlphttp/loki:
    endpoint: http://loki:3100/otlp
  otlphttp/tempo:
    endpoint: http://tempo:4318
    tls:
      insecure: true

service:
  pipelines:
    metrics:
      receivers: [otlp, spanmetrics]
      processors: [batch]
      exporters: [otlphttp/prometheus]
    logs:
      receivers: [otlp]
      processors: [batch]
      exporters: [otlphttp/loki]
    traces:
      receivers: [otlp]
      processors: [tail_sampling, batch]
      #processors: [batch]
exporters: [otlphttp/tempo, spanmetrics] - prometheus.yml:
Set up your scrape configurations and remote write settings. You can also configure Prometheus to scrape metrics from the OTEL Collector if needed.
otlp:
  # Ingest OTLP data keeping UTF-8 characters in metric/label names.
  # translation_strategy: NoUTF8EscapingWithSuffixes
  keep_identifying_resource_attributes: true
  # Recommended attributes to be promoted to labels.
  promote_resource_attributes:
    - service.instance.id
    - service.name
    - service.namespace
    - cloud.availability_zone
    - cloud.region
    - container.name
    - deployment.environment.name
    - k8s.cluster.name
    - k8s.container.name
    - k8s.cronjob.name
    - k8s.daemonset.name
    - k8s.deployment.name
    - k8s.job.name
    - k8s.namespace.name
    - k8s.pod.name
    - k8s.replicaset.name
    - k8s.statefulset.name
storage:
  tsdb:
out_of_order_time_window: 30m - tempo.yml:
Configure Tempo’s storage and query settings.
server:
  http_listen_port: 3200

distributor:
  receivers:                           # this configuration will listen on all ports and protocols that tempo is capable of.
    otlp:
      protocols:
        http:
          endpoint: 0.0.0.0:4318
        grpc:
          endpoint: 0.0.0.0:4317

storage:
  trace:
    backend: local                     # backend configuration to use
    wal:
      path: /tmp/tempo/wal             # where to store the wal locally
    local:
path: /tmp/tempo/blocks - grafana-datasources.yml:
Pre-provision data sources for Grafana so that when it starts, you immediately have dashboards ready for Prometheus, Loki, and Tempo.
apiVersion: 1
datasources:
  - name: Prometheus
    type: prometheus
    uid: prometheus
    access: proxy
    url: http://prometheus:9090
    basicAuth: false
    isDefault: false
    editable: false
    jsonData:
      exemplarTraceIdDestinations:
        - name: trace_id
          datasourceUid: tempo


  - name: Loki
    type: loki
    uid: loki
    url: http://loki:3100
    jsonData:
      derivedFields:
        - name: 'trace_id'
          matcherRegex: 'trace_id'
          matcherType: 'label'
          url: '$${__value.raw}'
          datasourceUid: 'tempo'


  - name: Tempo
    type: tempo
    access: proxy
    orgId: 1
    url: http://tempo:3200
    basicAuth: false
    isDefault: true
    version: 1
    editable: false
    apiVersion: 1
    uid: tempo
    jsonData:
      tracesToLogs:
        datasourceUid: 'loki'
        mappedTags: [ { key: 'service.name', value: 'service_name' } ]
        spanStartTimeShift: '-1h'
        spanEndTimeShift: '1h'
        mapTagNamesEnabled: true
        filterByTraceID: true
      serviceMap:
        datasourceUid: 'prometheus'
      search:
        hide: false
      nodeGraph:
        enabled: true
      lokiSearch:
        datasourceUid: 'loki'
For more detailed configurations, consult the documentation for each component.
Spinning Up the Observability Stack
Once you have your configuration files in place, you can launch the full stack with a single command:
docker-compose up -d This command will:
- Pull the necessary images.
- Mount your local configuration files.
- Start all services in detached mode.
After a few moments, you should be able to access:
- Grafana: http://localhost:3000
(Default credentials are usually admin/admin—be sure to change these after your first login.) - Prometheus: http://localhost:9090
- Loki: http://localhost:3100
- Tempo: http://localhost:3200
Instrumenting Your Application with OpenTelemetry
Now that your observability stack is running, the next step is to instrument your application. By using OpenTelemetry libraries in your code (whether via the Java agent, low-code annotations, or manual API calls), your application can send metrics, traces, and logs directly to the collector. The collector then routes this data to Prometheus, Loki, and Tempo for storage and visualization.
For example, if you’re using a Java application:
- Configure the OpenTelemetry Java Agent to send data to http://localhost:4317 (or 4318 for HTTP).
- Use the appropriate OpenTelemetry SDK libraries and instrument your code.
This integration gives you a complete pipeline—from instrumenting your application code to visualizing the resulting telemetry in Grafana.
Final Thoughts
By following this guide, you can quickly set up an open-source observability stack that scales with your application. This stack provides you with:
- Centralized telemetry collection via the OpenTelemetry Collector.
- Robust metrics storage and querying with Prometheus.
- Efficient log aggregation and search using Loki.
- Scalable distributed tracing with Tempo.
- Unified dashboards in Grafana for seamless visualization.
As you grow your application, you can customize and extend each component’s configuration to meet your specific needs. Happy observability!
Contact us to explore how we can help you build a powerful open-source observability stack with OpenTelemetry, Grafana, Prometheus, Loki, and Tempo. Let’s work together to enhance monitoring, streamline troubleshooting, and optimize your applications!
Relevant posts
Instrumenting Spring Boot Apps with OpenTelemetry
In modern microservices architectures, observability is key to maintaining performance and reliability. OpenTelemetry (OTel) has emerged as the standard for distributed logs, tracing and...
Frontend Observability: Improving users experience by knowing how your site is performing
The summarised version of this article was posted at mirzamuric.com/blog/frontend-observability. The performance of your website or app directly impacts user...

Making UX decisions: A guide for product builders
Are you juggling countless stakeholder demands with a ticking clock? Curious about how to make lightning-fast UX decisions without sacrificing...
Angular vs Blazor: Choosing the right framework for your web application
What is Angular? Angular is a front-end web framework developed by Google, built on TypeScript. It allows developers to build...
Changes to the Bitnami Image Catalog – Time to act now!
What is Bitnami? Bitnami is a provider of pre-packaged software bundles containing popular applications such as WordPress, Joomla or GitLab,...

Feature Flags as a Strategic Capability
How Modern Teams Deliver Faster, Safer Software Feature flags are no longer just toggles—they are a delivery capability that helps...
You need to load content from reCAPTCHA to submit the form. Please note that doing so will share data with third-party providers.
More Information